Cross Spherical Analysis
"Cross-spherical analysis" compares the sources returned by each of the internet's spheres (e.g., blogosphere) for the same query. It can, therefore, be seen as comparative ranking research. The digital methods approach may also be called "comparative source distance analysis." - Digital Methods
I used this digital method to systematically identify Our Data Helps within the web-based phenomenon of digital data shadow donation. This approach was significant for it provided a structure to 1) document the variety of data donation movements in each sphere, 2) analyze the kinds of data donation conversations happening, and 3) it enabled a systematic identification of Our Data Helps donors.
Method
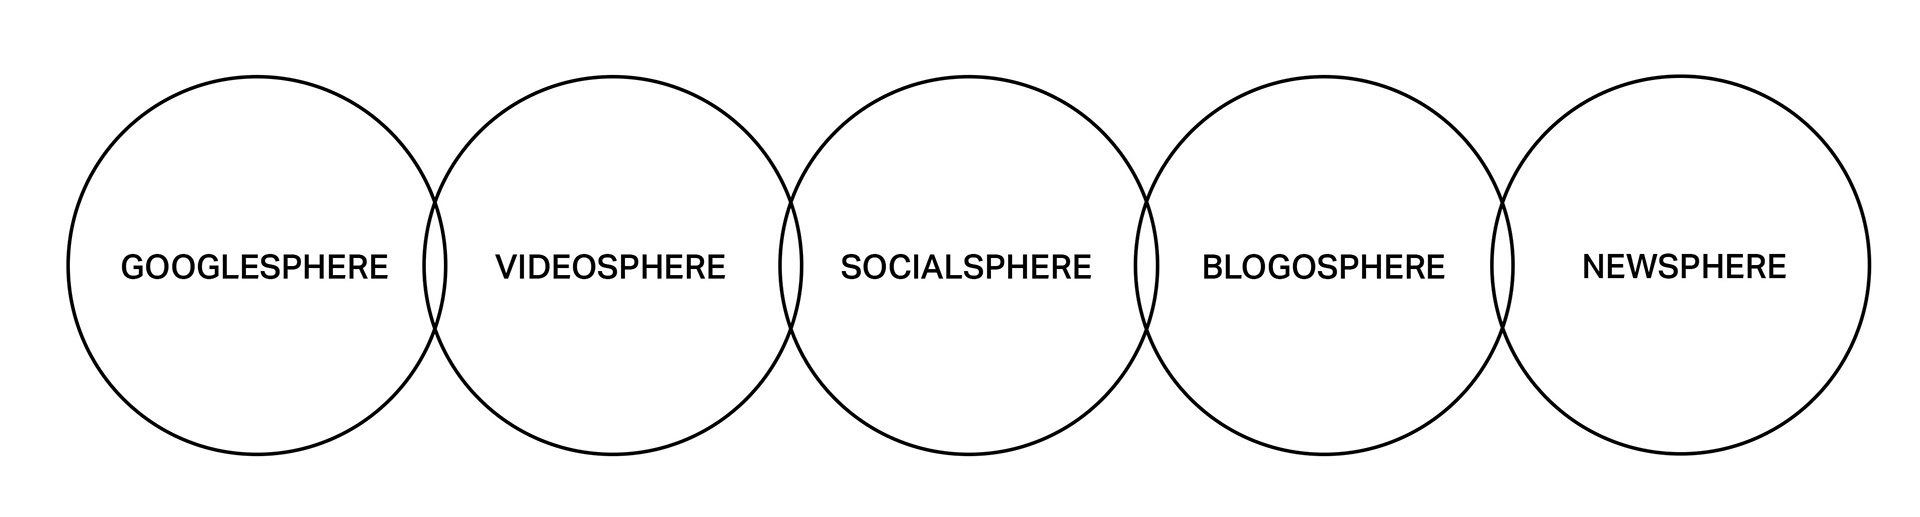
The first step, I designed and ran a data scraper. I ran the query term ‘data donation’ and / or ‘data donate’ across:
- Googlesphere using the Google search engine.
- Videosphere using YouTube.
- Socialsphere using Facebook and Twitter.
- Blogosphere Medium.
- Newsphere using Google News and The Wall Street Journal.
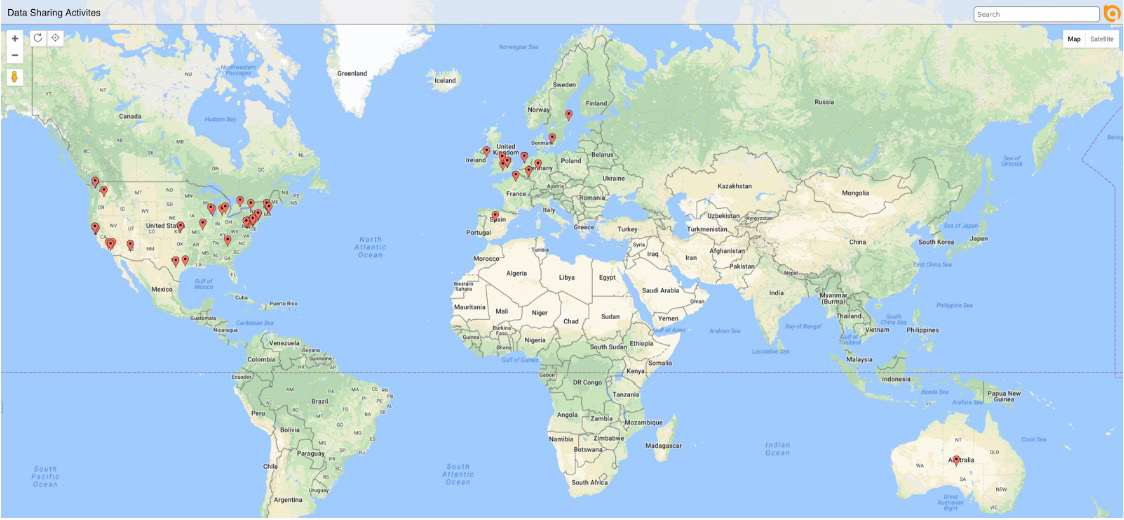
These engines returned an ordered list of sources that I interpreted as a confined space. I took the top 100 results from each respective engine and began a process of analysis and categorization. Using open coding and digital method tools I organized each source according to the data donation platform mentioned, the type of site, the content, the location, and the level of engagement. The spreadsheet tabling varied data sharing activities identified through this process can be found here.
Analysis
What the analysis of each sphere’s top 100 results made clear was that Our Data Helps was set in a diverse and global context of data sharing activities and
was one amongst only several data donation platforms. By having
categorized the donors and receivers of each data sharing activity I was able to see that the majority of data sharing activities were large scale corporate happenings (i.e. Data Collaboratives and Data Philanthropy) wherein citizens were not engaged. This identified that Our Data Helps was distinctive for its citizen engagement.
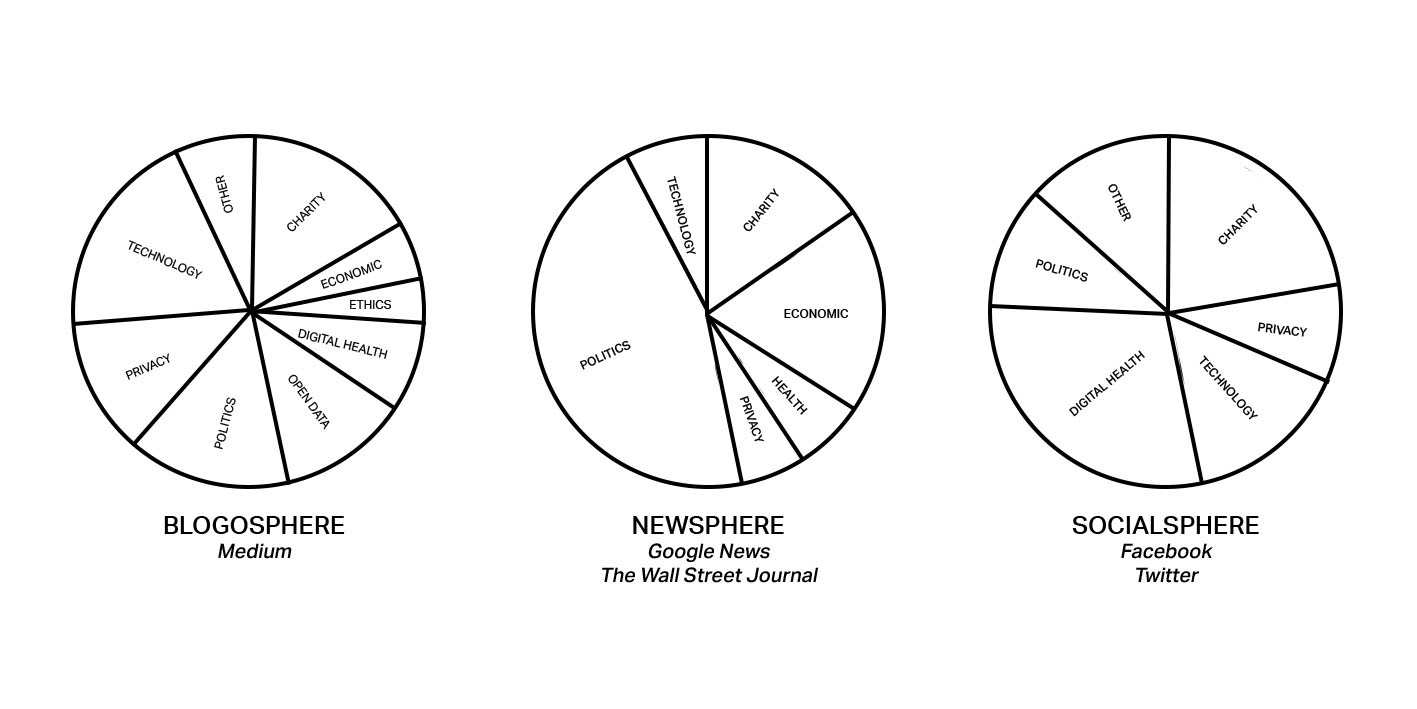
To understand which themes were most dominantly connected to data donation across the spheres, I used the data visualization method of word clouds and pie charts. This process revealed that data donation was linked to topics of 'charity,' 'politics and 'digital health.' Moreover, through the manual process of theme identification, I was able to identify that the Socialsphere and Googlesphere returned the most relevant sources, highlighting that the phenomenon of digital data donation abodes primarily in the realms of Google and on social media.
In line with this finding, I examined the content from Googlesphere and Socialsphere more carefully to find participants for phenomenological interviews. This process was integral as from the outset of this research, the finding of participants had posed a considerable concern. Plus, as these individuals were already speaking online about their experiences donating their data, I felt comfortable approaching them about this topic. This digital method, therefore, provided a way to find digital data donors that embodied Couldry's (2013) advocacy for the virtues of accuracy, sincerity, and care.
Data Visualisation
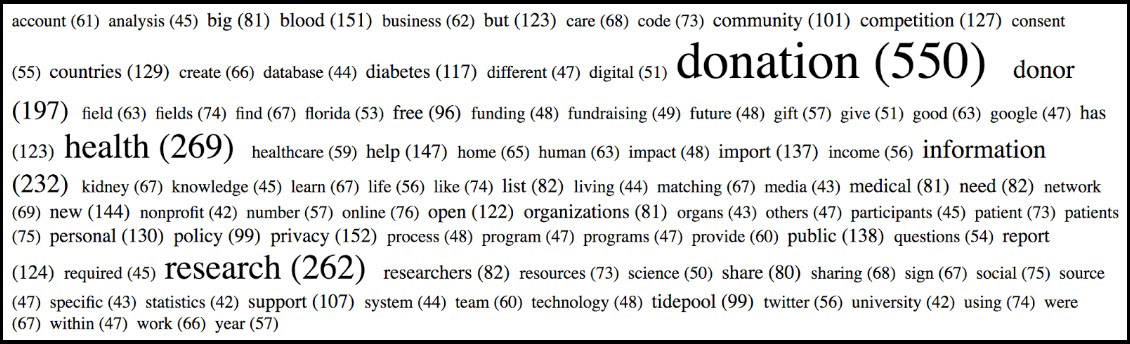
Googlesphere Word Cloud - Cross Spherical Analysis, Joanna Sleigh, 2017
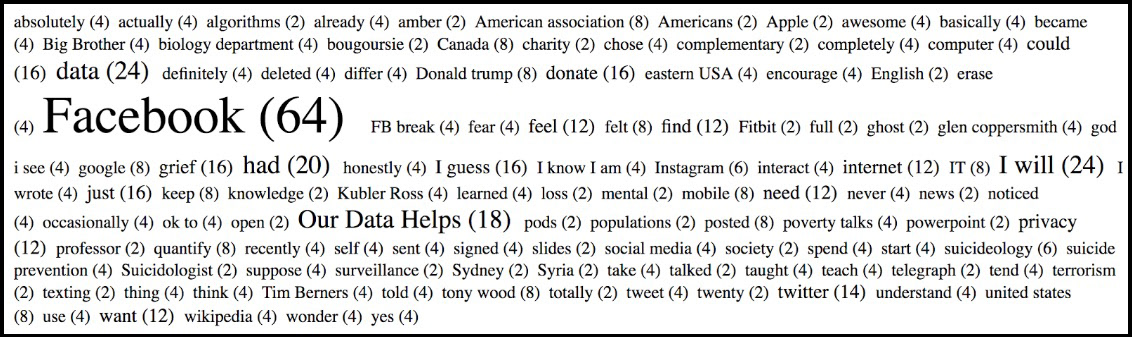
Socialsphere Word Cloud - Cross Spherical Analysis, Joanna Sleigh, 2017